


What the Benefits of Warehouse Automation Actually Add Up To
Automation moves five measurable numbers: labour hours per order line, peak throughput, storage positions per square metre, inventory record accuracy and recordable safety incidents. Each moves because of a specific mechanism, and every mechanism carries a constraint. The gains concentrate where volume is high and stable, and erode quickly where order profiles are erratic or seasonal.
Which gains are measurable on day one?
Two: storage positions per square metre and throughput ceiling. Density comes from deleting aisles, replacing one aisle per two pallet rows with one aisle serving a lane many pallets deep, and from building vertically to the height the lift and rack structure allow. Throughput is a specification you commission against. Both are geometry and hardware, verifiable at handover.
Which gains take 12 to 24 months to appear?
Labour hours per order line, inventory accuracy and safety performance. Labour savings need stable process discipline around the system. Accuracy improves because every movement is a confirmed transaction rather than a keystroke. Safety improves because people stop working under load, though you should benchmark against published warehousing injury rate data rather than assume a percentage.
Why the same system delivers different results in two buildings
SKU velocity spread, dock schedules, ceiling height and order line depth all shift the outcome. The warehouse automation advantages you realise depend on which of those constraints binds first, which is why understanding what warehouse automation actually covers matters before specifying.
Labour Savings: Which Hours Disappear and Which Ones Move
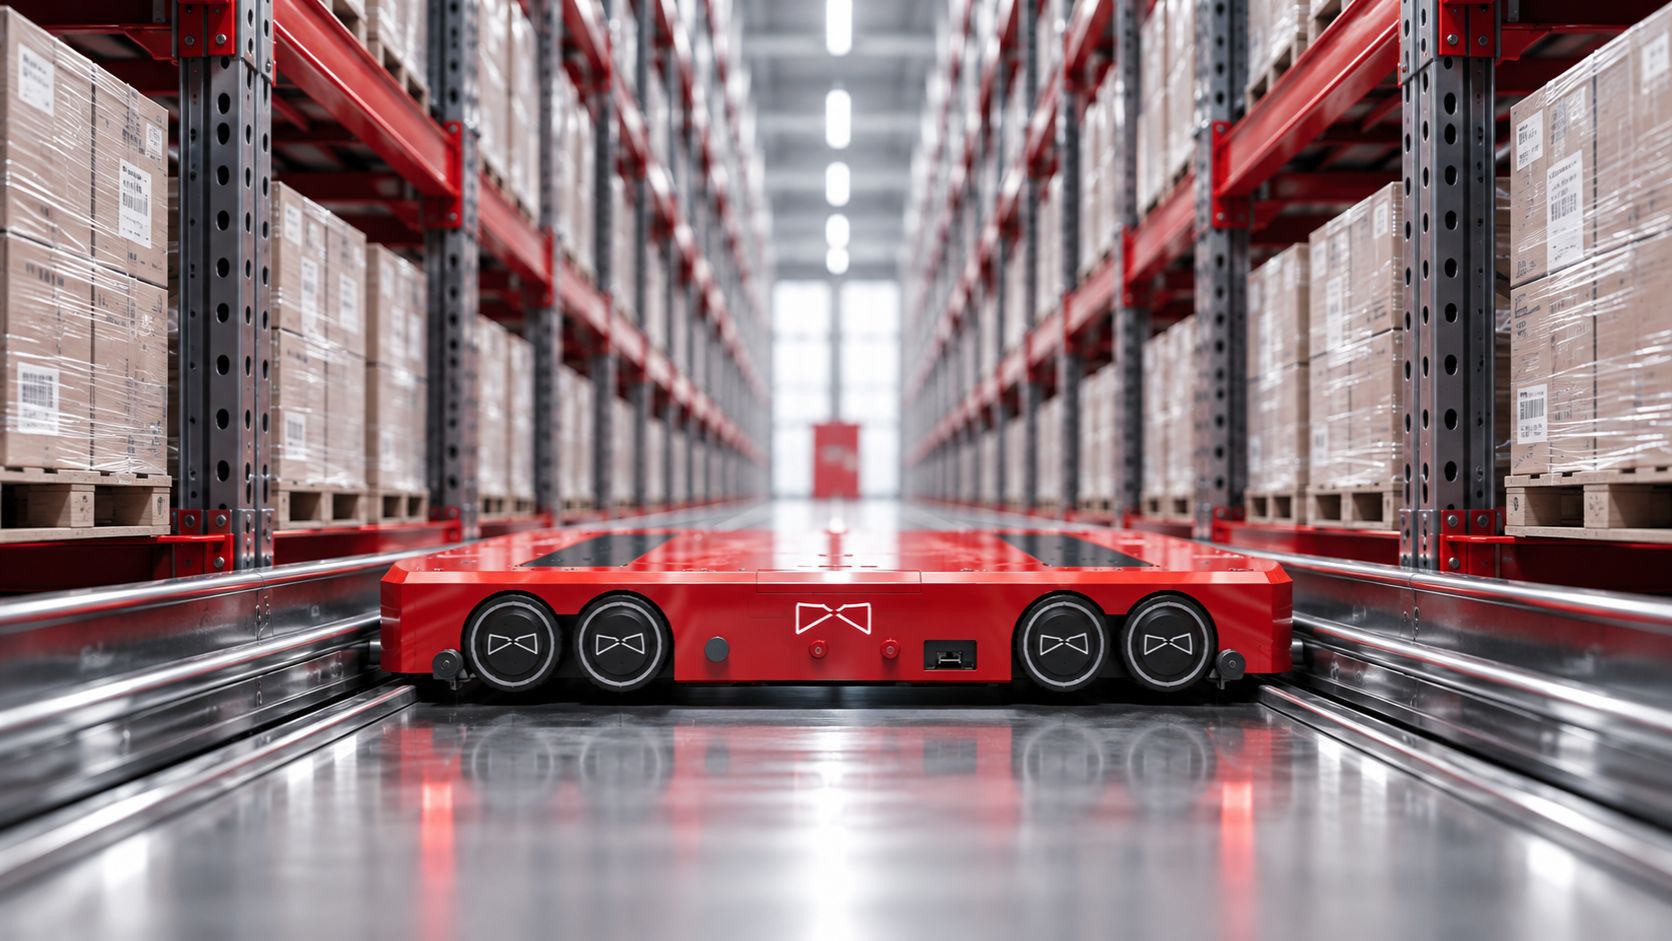
The labour savings warehouse buyers are promised almost never come from operators picking faster. They come from deleting the walk. In a conventional person-to-goods operation, travel and search routinely consume the majority of a picker’s shift, which is why travel time studies in order picking consistently identify it as the largest single cost component. Automation attacks that block of time, not the operator’s judgement or dexterity. An in-rack shuttle system presents the tote or pallet at a station, so the same person handles sequential presentations instead of covering aisle distance between each line.
Which tasks automation removes outright
- Aisle travel and location search between pick lines
- Forklift trips for putaway, replenishment and retrieval in the storage block
- Double-handling at the staging buffer, since stock moves once into the grid and once out
- Manual cycle counting driven by location uncertainty
Which roles you have to add back
- Maintenance technicians on every shift the system runs
- A controls or WCS engineer, in-house or retained
- Night-shift response capability, because an unattended fault stops throughput
- Exception handlers for jams, damaged totes and rejected inventory
What happens to picks per operator hour
Station-based picking raises picks per operator hour substantially, but gross hours removed and net headcount reduction are different numbers. Model both, or the business case overstates itself.
Throughput and Density: The Two Numbers Worth Arguing About
Every in-rack system is bought on two numbers: pallets per hour and storage positions per square metre. Vendors quote both at their individual peaks, rarely at the same time, because the configuration that maximises one degrades the other.
What sets the pallets-per-hour ceiling
Throughput is bounded by whichever resource saturates first. A shuttle completes a cycle in the time it takes to travel to a position, engage the pallet and return to the lift interface, so shuttle count multiplied by cycles per hour sets the horizontal capacity. Lifts set the vertical capacity, and in most layouts the lift is the constraint, not the shuttle. Check the specification sheet for lift cycle time at full load and the number of lifts per aisle, then compare that figure against your peak hour inbound plus outbound volume. If single cycles dominate because receiving and dispatch peak at different times, effective throughput drops against the dual-cycle number on the brochure.
Lane depth versus retrieval time
Lane depth in metres drives density. Each additional pallet position behind the face adds storage without adding aisle, which is why deep-lane pallet shuttle racking delivers far more positions per square metre than single-deep selective. The cost is retrieval time for buried pallets: reaching position eight in a lane means the shuttle travels the full lane depth, and if the SKU behind the face is wrong, you are relocating pallets before you pick one.
Why density and throughput pull in opposite directions
Single-deep selective gives instant access to every SKU and spends floor on aisles to do it. Deep-lane high-density storage recovers that floor but requires sequencing discipline, ideally one SKU per lane. Low SKU count with high volume per SKU favours depth. Broad, fragmented ranges do not.
Accuracy, Stock Visibility and a Safer Floor
Why machine-confirmed moves beat manual counts
Manual picking depends on an operator reading a label, walking to a location and remembering what they did. Each of those steps is a place where the record and the reality separate. An in-rack shuttle system removes them. The control layer issues a move, the shuttle executes it against a known lane and depth, and the move is confirmed back before the next task is released. Stock location becomes machine-known rather than operator-known. The physical basis for that confidence is positioning tolerance measured in millimetres, tight enough that a put or pick either completes cleanly or faults rather than quietly landing in the wrong slot.
What changes in cycle counting workload
When every move is confirmed, counting shifts from verifying the whole population to auditing exceptions and damage. Teams that previously ran wall-to-wall counts move toward sampling, which is where most of the labour reduction in inventory accuracy and cycle counting comes from.
The safety risks automation creates
Forklift and pedestrian interactions fall sharply, and nobody manhandles loads above comfortable payload limits. In exchange you create new exposures: maintenance access inside a live grid, strict lockout tagout discipline, and technicians working at height between rack levels. Automation relocates risk toward a smaller, trained group. It does not delete it.
Handling Peaks, Growth and Running Costs
Scalability, resilience and running cost claims all trace back to one mechanism: automated capacity is fixed where human capacity is elastic. That single difference explains most of the automation benefits operations directors hear about, and most of the disappointments.
How peak capacity is added after go-live
In-rack systems scale by unit, not by rebuild. Adding shuttles to existing rack levels or a second lift to a busy aisle raises throughput inside the grid you already own, with commissioning measured in days rather than a new build programme. Storage and throughput scale independently, which is why building for peak rather than average is a design decision, not a procurement one.
Why a fixed ceiling cuts both ways
Peak volume is absorbed without hiring, inducting or training seasonal labour. But once demand exceeds the designed pallets-per-hour rate, overtime buys nothing. The ceiling is physical, so peak profiles have to be modelled honestly before contracts are signed.
Energy and lights-out operation
Lifts with regenerative braking return energy on descent, and shuttles run unlit and in chilled or sub-zero space. Stable cycle times also let you move order cut-offs later without risking the delivery promise.
Benefit, Mechanism, Measure, Cost
Take every claim made so far and audit it against the mechanism that produces it, the metric that proves it, and the line item it adds.
| Benefit | What Produces It | How to Measure It | What It Costs You |
|---|---|---|---|
| Labour hours | Shuttles replace travel and search | Picker hours per 1,000 lines | Technicians on shift, training time |
| Throughput | Parallel shuttles plus lift cycles | Cases or totes per hour, sustained | More shuttles, more lifts, more capex |
| Storage density | Deep lanes, narrow aisles, full height | Pallets per square metre | Slower selectivity in deep lanes |
| Inventory accuracy | Location confirmed at every move | Cycle count variance, percent | WMS integration hours |
| Safety | People separated from moving loads | Recordable incidents per 200,000 hours | Guarding, interlocks, permit procedures |
| Peak flexibility | Add shuttles without rebuilding rack | Peak day rate versus baseline | Idle assets off-peak |
| Energy | Regenerative braking, lights-out aisles | kWh per tote handled | Higher connected load at commissioning |
Read the right-hand column first. Each benefit converts a variable cost into a fixed one, which is only defensible at volume you can forecast.
The Trade-Offs the Benefit Lists Leave Out
Any honest discussion of the advantages and disadvantages of automated warehouses has to account for what you give up. The benefits are real. So are the constraints, and most of them arrive after the purchase order is signed.
Where the capital actually goes
- Steel, not robots. Rack structure, anchoring, floor flatness correction and fire protection frequently absorb more budget than the shuttles themselves.
- Integration labour. WMS interfacing, testing and site commissioning are project costs, not equipment costs, and they scale with the complexity of your order profile rather than with bay count.
- Payback horizon. Most in-rack projects recover capital over years, not quarters. Our breakdown of warehouse automation ROI sets out how to model that properly.
What breaks the business case
- Change after commissioning is expensive. Once steel is installed and anchored, relocating aisles or changing bay pitch is a construction job.
- Lift exposure. A lift outage isolates levels. Redundant lifts cost money; skipping them concentrates risk at a single point.
- Software dependency. Throughput lives in the control layer. Poor warehouse control system logic wastes good mechanics.
- Service response. Spare parts location and engineer response time determine real availability, not published MTBF.
- Live-site disruption. Commissioning inside a running operation costs picking hours.
- Awkward SKUs. Oversized, unstable and very slow-moving stock rarely earns its automated location.
When conventional racking is the right answer
- Low daily throughput that manual picking already absorbs.
- Highly variable load dimensions with no stable footprint.
- Short building leases or uncertain tenure.
- 3PL sites with unpredictable client mix and contract churn.
 Questions Operations Directors Ask Before Signing
1. How long until automation pays back?
Payback is driven by shift pattern, local labour rate, building cost per square metre and how much of the year runs near design capacity. A three shift operation in a high rent region recovers capital far faster than a single shift site with cheap land. Model it against your own wage drift, not a vendor average.
2. Does automation mean redundancies?
Not automatically. Most operations redeploy pickers into replenishment, exceptions handling and maintenance, then absorb growth without rehiring. Redundancies happen where volumes are flat and headcount is already tight.
3. What throughput justifies in-rack automation over forklifts?
Look at pallet moves per hour at peak, SKU depth and how many aisles forklifts currently need. When travel time dominates and aisles consume more floor than stock, the case shifts.
4. Can the system expand after commissioning?
Yes, if the control architecture and lift capacity were specified with spare headroom. Retrofitting that headroom later costs more than buying it upfront.
Decide on the Numbers, Not the List
Automation earns its capital when the mechanism behind each benefit lines up with your volume profile, SKU count, order lines per pick and the building you actually occupy. Where that alignment is missing, the same system produces slower cycles, stranded stock and a payback that keeps moving. Nothing in a benefits list tells you which case you are in. Your own numbers do.
Before you take a vendor meeting, fill in the four columns yourself: benefit, mechanism, measure, cost. Put real figures against each row, including the ones that hurt. If the case holds, HWArobotics can model throughput and density against your order profile and show where the limits sit.